

Understanding kWh Solar Panel Size Chart: Your Guide to Smarter Energy Planning
Table of Contents
Why Solar Panel Size and kWh Output Matter
Ever wondered why two identical-looking rooftop installations produce vastly different energy? Here's the reality: physical size alone doesn't determine kWh output. While residential panels typically measure 1.7m x 1m (≈5.6ft x 3.3ft), their annual yield depends on:
- Panel efficiency (15-22%)
- Geographic location & solar irradiance
- Roof tilt and orientation
- Shading and weather patterns
This disconnect between physical dimensions and energy production is precisely why a well-designed kWh solar panel size chart becomes indispensable for accurate planning.
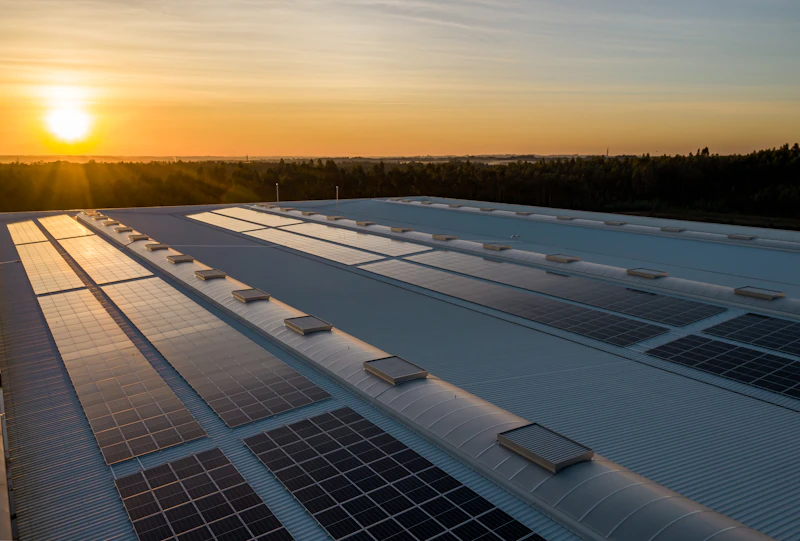
Image: Typical residential solar installation showing panel size variations. Credit: Unsplash/Photographer Name
Decoding Solar Panel Size Charts: From kW to kWh
Solar sizing charts translate physical dimensions into practical energy expectations. Consider this reference table for European conditions:
| System Size (kW) | Panels Required (330W) | Roof Area Needed (m²) | Annual kWh Output (Southern EU) | Annual kWh Output (Northern EU) |
|---|---|---|---|---|
| 3 kW | 9 | 15-18 m² | 3,600-4,200 kWh | 2,400-2,800 kWh |
| 6 kW | 18 | 30-36 m² | 7,200-8,400 kWh | 4,800-5,600 kWh |
| 10 kW | 30 | 50-60 m² | 12,000-14,000 kWh | 8,000-9,300 kWh |
Note: Based on standard monocrystalline panels at 20° tilt. 15% buffer included for real-world efficiency losses (Source: EU Energy Directorate)
Three key conversion principles emerge:
- Watt-peak vs. Reality: A 400W panel produces ≈320W sustained output
- Sun-hour multiplier: Munich gets 2.8 peak sun-hours/day vs. Madrid's 4.9
- Degradation factor: Output decreases ≈0.5%/year post-installation
European Case Study: Real Data from Spain
Consider the Rodríguez family near Seville (2023 installation):
- Challenge: Achieve 6,000 kWh/year for full energy independence
- Solution: 20x 400W panels (8kW system)
- Physical footprint: 34m² roof space
Actual first-year results? 6,840 kWh - 14% above projections. How? Through:
- Optimized 22° tilt angle
- Micro-inverters minimizing shade losses
- Bi-monthly cleaning regimen
Contrast this with a similar-sized system in Hamburg producing 4,920 kWh annually. This 40% regional difference underscores why location-specific kWh charts matter. (Data source: Fraunhofer ISE).
How to Use a kWh Solar Panel Size Chart
Transform theoretical charts into actionable plans with this 4-step approach:
- Calculate your annual kWh consumption from utility bills
- Identify your location's solar yield potential (Global Solar Atlas)
- Apply the formula: System Size (kW) = Annual kWh ÷ (Peak Sun-hours × 365)
- Add 20% buffer for degradation, seasonal variations, and future usage
Example for London household needing 4,500 kWh/year: 4,500 ÷ (2.8 × 365) ≈ 4.4 kW system → Install 13x 340W panels
Optimizing Your Solar Array for Maximum kWh
Beyond panel count, consider these kWh-boosting strategies:
- Bifacial panels: Generate up to 20% extra kWh using reflected light
- Dynamic mounting: Seasonal tilt adjustments gain 8-12% output
- Battery pairing: Store excess kWh instead of exporting at low rates
As SolarPro's lead engineer Markus Becker notes: "Our German clients using smart battery systems achieve 92% self-consumption vs. 45% for grid-only systems – effectively doubling each panel's kWh value."
Future Trends: Smaller Panels, Higher kWh?
Emerging technologies are reshaping sizing paradigms:
| Technology | Size Reduction | kWh Gain | Commercial Availability |
|---|---|---|---|
| Perovskite-silicon tandem | Same footprint | 25-30% ↑ | 2025 (Pilot projects) |
| Building-integrated PV | Zero roof space | Varies | Now (France/Germany) |
| Micro-tracking systems | +10% array size | 35% ↑ | Now (Premium installs) |
Already, Swiss startup Insolight achieves 29% efficiency with lenses focusing light onto tiny solar cells – potentially halving physical sizes for equivalent kWh output.
Your Turn: What's Your Solar Profile?
Imagine your energy future: Could your unused roof space right now be silently generating your next 2,000 kWh? What specific energy consumption pattern makes solar sizing most challenging in your unique situation?
 Inquiry
 Online Chat