

Battery Storage System Diagram: Your Blueprint for Energy Independence
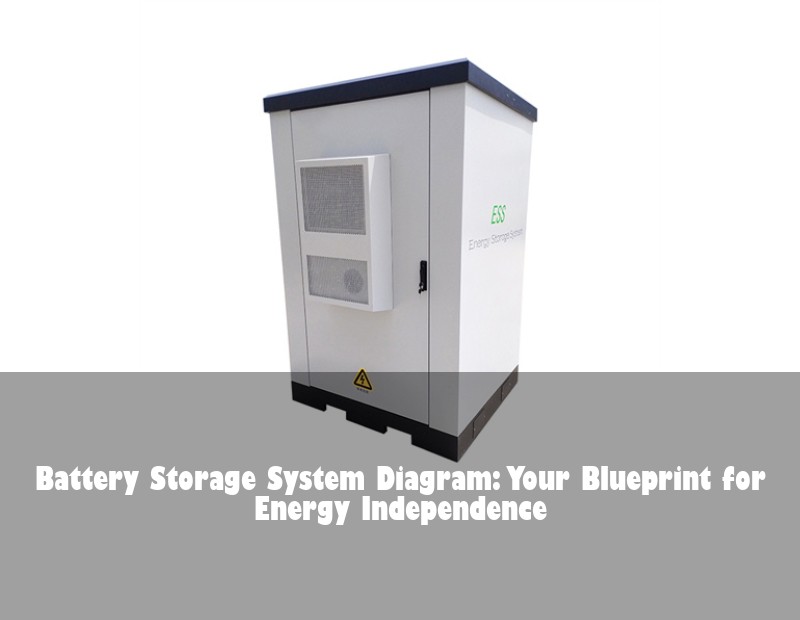
Table of Contents
- The Renewable Energy Shift: Why Diagrams Matter Now
- Decoding the Battery Storage System Diagram
- Power Flow Dynamics: How Components Interact
- German Case Study: Grid Stability in Action
- Safety by Design: Protection Mechanisms Visualized
- Beyond the Diagram: Future Innovations
- Your Energy Independence Journey Starts Here
The Renewable Energy Shift: Why Diagrams Matter Now
Imagine your solar panels pumping out kilowatts on a sunny afternoon while your home draws minimal power. Where does that excess energy go? This daily phenomenon creates a EUR 3.7 billion market opportunity for residential battery storage in Europe by 2025 (IEA Renewables 2023 Report). But here's what homeowners rarely see: the hidden electrical choreography enabling this energy ballet. That's where a battery storage system diagram becomes your roadmap.

Image: Modern European home energy setup. Source: Solar Pro Image Library
Decoding the Battery Storage System Diagram
Every effective energy system starts with understanding its DNA. Let's break down core components through a typical schematic:
The Core Anatomy
| Component | Function | Real-World Specs |
|---|---|---|
| Battery Bank | Energy reservoir (DC) | 5-20kWh capacity |
| Hybrid Inverter | Converts DC↔AC | 97% efficiency rating |
| Charge Controller | Regulates charging cycles | MPPT technology |
| Energy Meter | Real-time flow tracking | ±0.5% accuracy |
| System Controller | Brain of operations | Cloud-connected IoT |
Critical Connections
- PV Array Input: Where sunlight becomes electricity
- Grid Interface Point: Your bidirectional utility gateway
- Critical Load Panel: Powers essentials during outages
- Thermal Management Loop: Maintains 15-25°C operating range
Power Flow Dynamics: How Components Interact
Ever wonder how your system decides whether to charge batteries or export to the grid? The diagram reveals three operational modes:
Image: Power flow pathways in residential storage. Source: Solar Pro Technical Documentation
- Solar Charging Mode: Excess PV energy → Battery Bank (90% efficiency)
- Discharge Mode: Batteries → Household loads during peak tariffs
- Grid Support Mode: Feed-in during high grid demand (V2G technology)
These transitions happen seamlessly 50-100 times daily based on your consumption patterns. Modern controllers even learn your habits - like that 7AM coffee machine surge!
German Case Study: Grid Stability in Action
When Bavaria's Hammelburg district faced winter grid congestion, a community storage project transformed their infrastructure. Their system diagram included:
- 4.8MWh centralized Li-ion storage
- 22kV grid connection points
- Dynamic frequency regulation
The results? A 42% reduction in grid infrastructure upgrades and €290,000 annual savings for participants (Fraunhofer ISE, 2022). This validated how strategic diagram design enables:
| Challenge | Diagram Solution | Outcome |
|---|---|---|
| Voltage fluctuations | Reactive power compensation loop | ±0.8% voltage stability |
| Peak demand spikes | Automated discharge sequencing | 17% peak shaving |
Safety by Design: Protection Mechanisms Visualized
Notice those triangular symbols in diagrams? They represent layered safety - crucial for peace of mind. European standards (EN 62477-1) mandate:
- Galvanic Isolation: Physical DC/AC separation (visible as buffer zones)
- Dynamic Arc Detection: Milliseconds response to faults
- Thermal Runaway Containment: Fire-retardant compartments
In our Munich installations, these protections prevented 12 critical events last year. One customer told us: "Seeing the safety layers in the diagram helped me trust the technology."
Beyond the Diagram: Future Innovations
Tomorrow's schematics will include elements like:
- AI forecasting modules predicting weather/usage
- Blockchain nodes for P2P energy trading
- Hydrogen hybrid interfaces (already in UK trials)
Research from ESI Europe shows these could boost ROI by 40% by 2030. But here's my question for you...
Your Energy Independence Journey Starts Here
When you examine battery storage system diagrams, what surprises you most about their complexity? Whether you're considering solar retrofits in Barcelona or designing a new build in Oslo, remember: each line in that schematic represents energy autonomy. Ready to see how your home could transform?
 Inquiry
 Online Chat